Question
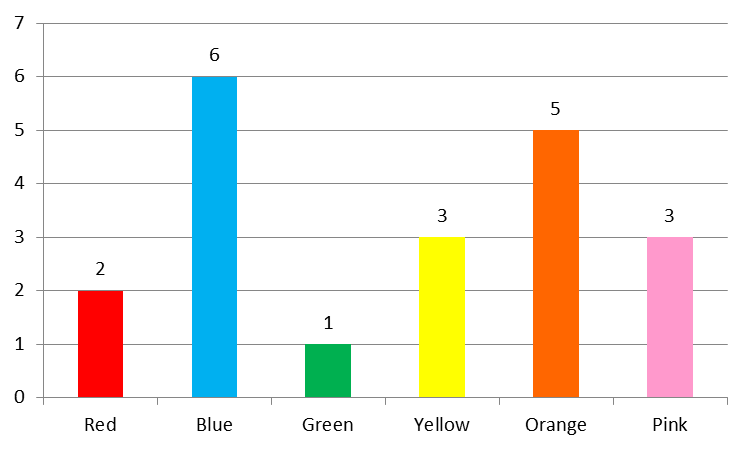
The following bar graph shows the favourite colours of 20 students of a class.

From the graph, it can be inferred that
Answer: Option A
:
A and C
From the graph, it can be observed that:
Frequency of Blue = 6
Frequency of Orange=5
Frequency of Yellow=3
Frequency of Pink=3
Frequency of Red=2
Frequency of Green=1
Therefore, blue is most favoured colour and orange is second most favoured colour. Thus, options A and C are correct. The least favoured colour is green so option B is incorrect. Also the frequency of green and pink are different. So option D is also incorrect.
Was this answer helpful ?


Submit Solution