Exams > Cat > Di And Lr
BASIC DI MCQs
Total Questions : 73
| Page 5 of 8 pages
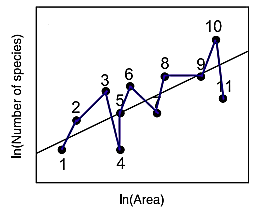
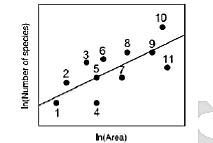
Question 41. This curve gives you the number of species residing in a particular area (1,2,3…..11). If all points in the given curve are joined in order 1-2-3-4-5-6-7----so-on-till—11, for how many sets of three points do we see growth followed by decline?(for eg, for the set 2-3-4, first it rises and then it declines)___

Answer: Option D. -> Rs 515 lakh
:
D
As calculated in the previous question, total interest = (39 + 64) = Rs 103 lakh
Given that, this interest is calculated on 20% of the borrowed fund.Hence, borrowed funds = (103×100)20= Rs 515 lakh.
:
D
As calculated in the previous question, total interest = (39 + 64) = Rs 103 lakh
Given that, this interest is calculated on 20% of the borrowed fund.Hence, borrowed funds = (103×100)20= Rs 515 lakh.
Answer: Option B. -> Seeta
:
B
By observation of the slope of the lines we can conclude that Seeta’s salary has grown at the maximum rate in the first two months
:
B
By observation of the slope of the lines we can conclude that Seeta’s salary has grown at the maximum rate in the first two months
Answer: Option C. -> D only
:
C
Curve C is parabolic in nature. B is also parabolic up to a point and then it almost saturates. A shows exponential growth. D shown linear growth initially and then gradually the growth flattens and thus it saturates
:
C
Curve C is parabolic in nature. B is also parabolic up to a point and then it almost saturates. A shows exponential growth. D shown linear growth initially and then gradually the growth flattens and thus it saturates
Question 45. Consider the following Time Distance graph. The graph shows four cars A, B, C and D racing on parallel tracks for a 40 km race.
With reference to graph, consider the following statements:
(1) A was the fastest of the lot in the beginning.
(2)The race was won by D.
(3) D was the slowest in the beginning.
(4) C was always ahead of D
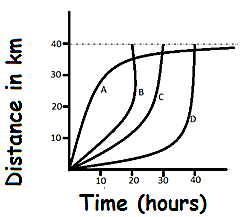
Which of the following statements given above is/are correct?
With reference to graph, consider the following statements:
(1) A was the fastest of the lot in the beginning.
(2)The race was won by D.
(3) D was the slowest in the beginning.
(4) C was always ahead of D

Which of the following statements given above is/are correct?
Answer: Option D. -> 1, 3 and 4 only
:
D
From the graph we can make the following conclusions
1) A was the fastest in the beginning (till around 30km mark)
2) D was the slowest till around 35 km mark
3) B won the race
So statements (1), (3) and (4) are true .
:
D
From the graph we can make the following conclusions
1) A was the fastest in the beginning (till around 30km mark)
2) D was the slowest till around 35 km mark
3) B won the race
So statements (1), (3) and (4) are true .
Answer: Option A. -> 23%
:
A
Required percentage increase in operating profit =
160−130130×100=23
:
A
Required percentage increase in operating profit =
160−130130×100=23
Answer: Option B. -> 2003
:
B
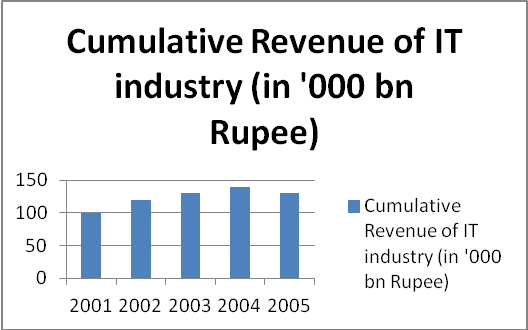
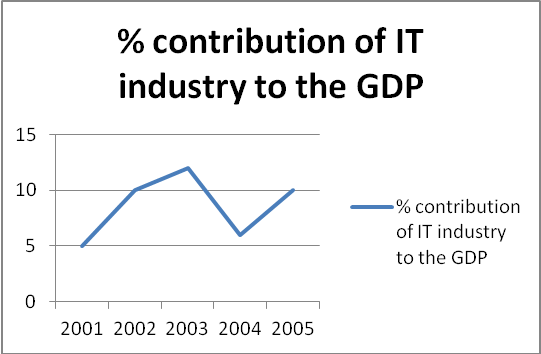
You can directly mark the answer as option (b)without any calculation. From 2001-2003, both the graphs are increasing. Thus 2003 will have the maximum value among 2001, 2002 and 2003. But then there is a big dip in the second curve which cannot compensate the increase in the first curve.
Thus, it is quite clear from the graphs that the maximum value can be only from 2003 or 2005.
Revenue from IT industry is same for both 2003 and 2005, but the % contribution to GDP for 2003 is higher than for 2005. Thus (b) is the answer
Answer: Option C. -> Switzerland
:
C
Option (c) Ratio of share of value to share of quantity for Pakistan – little less than 1Turkey – little greater than 1Switzerland – much greater than 1India – less than 1Hence Switzerland has the highest price for its supply.
:
C
Option (c) Ratio of share of value to share of quantity for Pakistan – little less than 1Turkey – little greater than 1Switzerland – much greater than 1India – less than 1Hence Switzerland has the highest price for its supply.
Answer: Option C. -> 27%
:
C
Average price of gold in 2008 = 11,800
Average price of gold in 2009 =14,600
Average price of gold in 2010 =19,000
The growth rate of 2009 (over 2008) for gold =14,600−11,80011,800 = 2,80011,800 × 100= 23.7%
The growth rate of 2010 (over 2009) for gold = 19,00014,600 = 4,40014,600× 100= 30.1%
Required change =30.1−23.723.7 × 100 = 27%.
Answer: Option A. -> 2:1
:
A
Let total population of Delhi is 100.
Number of teachers = 15 and number of engineers = 30
Number of engineers in the age group (31-40) = 304(since 90 = 3604); Ratio = 2:1.
:
A
Let total population of Delhi is 100.
Number of teachers = 15 and number of engineers = 30
Number of engineers in the age group (31-40) = 304(since 90 = 3604); Ratio = 2:1.

