Exams > Cat > Di And Lr
BASIC DI MCQs
Total Questions : 73
| Page 2 of 8 pages
Answer: Option D. -> lower by 1.5%
:
D
Retained profit in 1900-91 = (25% of 130) = Rs 32.5 lakh
Retained profit in 1991-92 = (20% of 160) = Rs 32 lakh
=(32.5−32)32.5=1.5
:
D
Retained profit in 1900-91 = (25% of 130) = Rs 32.5 lakh
Retained profit in 1991-92 = (20% of 160) = Rs 32 lakh
=(32.5−32)32.5=1.5
Answer: Option C. -> 2001-2006
:
C
(a) 1998-2000: it’s exponential increase
(b) 2000-2003: it’s exponential decrease
(c)2001-2006: it’s very close to parabolic
(d) 1998-2003: it first rises and then falls.
:
C
(a) 1998-2000: it’s exponential increase
(b) 2000-2003: it’s exponential decrease
(c)2001-2006: it’s very close to parabolic
(d) 1998-2003: it first rises and then falls.
Answer: Option A. -> 1:1
:
A
Option A. We can conclude form the given table that the ratio of number of products produced by Samsung to the number of mobiles sold in the market in the year 2010 is 1:1..
:
A
Option A. We can conclude form the given table that the ratio of number of products produced by Samsung to the number of mobiles sold in the market in the year 2010 is 1:1..
Answer: Option B. -> Coffee
:
B
Shortcut: Except 1990, we can see that for each of the year between 1989-1992, coffee has higher exports as compared to tea. And for 1990, the higher production of coffee is compensated by much higher production of tea in other months. Conventional: We can calculate the exact export data for each year and then compare the two. We will still get the same answer
Answer: Option C. -> between 1 and 2
:
C
Dell’s revenue in 2011 was 180mn. Then Sony’s revenue in 2011 was 270mn and Sony’s revenue grew at 25% from 2009 to 2011. Sony’s revenue in 2009 = 216mn and Dell’s revenue in 2010 = 150 mn.
:
C
Dell’s revenue in 2011 was 180mn. Then Sony’s revenue in 2011 was 270mn and Sony’s revenue grew at 25% from 2009 to 2011. Sony’s revenue in 2009 = 216mn and Dell’s revenue in 2010 = 150 mn.
Answer: Option D. -> 2000
:
D
The difference between the productions of Companies X and Y in various years are:
For 1997 (139000 - 119000) = 20000.
For 1998 (120000 - 99000) = 21000.
For 1999 (141000 - 100000) = 41000.
For 2000 (128000 - 78000) = 50000.
For 2001 (120000 - 107000) = 13000.
For 2002 (159000 - 148000) = 11000.
Clearly, maximum difference was in 2000. (From the graph, we can be sure that answer is either 1999 or 2000. So we need to calculate only for those two years)
Method-2
Visually,for the year 1997, there is a difference of 1( number of rows)
For 1998, 1
For 1999, 2
For 2001, 2.5 So the highest is for 2000
:
Given 10% = 6000
So content development cost,30%= 18000
So Revenue= 4×18000=72000 (Since, it is given that content development cost is 300% higher)
Total cost = 60000
So profit = 12000
Promotion cost = (20100×60000=12000)
So promotion cost is 100% of the profit.
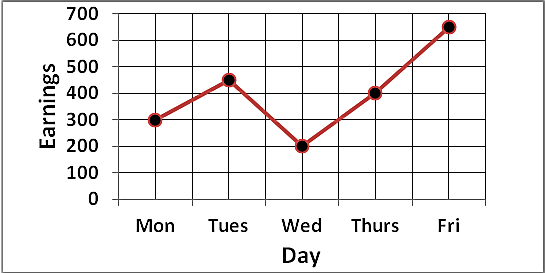
Answer: Option D. -> Tues, Fri
:
D
Average earning of Tuesday and Friday is (450+650)2=550 And it is the highest.
:
D
Average earning of Tuesday and Friday is (450+650)2=550 And it is the highest.
Question 20. The person who conducted the survey, by mistake, did not include some players. When they were included, the number of players who played cricket increased by 40% and while the number of hockey players saw an increase of 100%. If the number of players in all other games remained constant, what will be the degree of the tennis players in the corrected graph?
Answer: Option C. -> 450
:
C
Let total number of players = 100
The number of players who played cricket = 25 and number of players who played hockey = 10
The number of players who played cricket increased by 40% and while the number of hockey players saw an increase of 100%, now total number of players who played cricket = 35 and total number of players who played hockey = 20, Now total number of players = 120
Angle made by the players who played tennis = 15120 × 360 =450.


