Exams > Cat > Di And Lr
BASIC DI MCQs
Total Questions : 73
| Page 1 of 8 pages
Answer: Option D. -> 1970-90
:
D
From the given curve, it is evident that minimum share of income earned by top 1% of earners is lowest for the period 1970-90 and therefore in the same period, US witnessed lowest “Economic disparity”.
:
D
From the given curve, it is evident that minimum share of income earned by top 1% of earners is lowest for the period 1970-90 and therefore in the same period, US witnessed lowest “Economic disparity”.
Answer: Option B. -> 2009
:
B
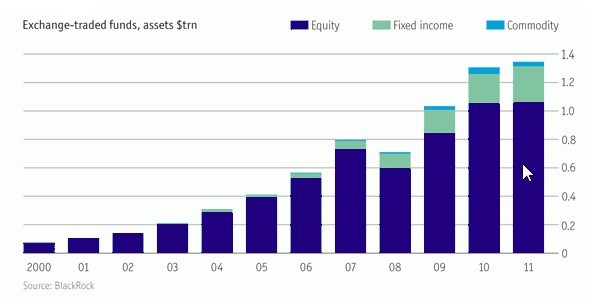
Just by observation, you can be sure that 2008 can be eliminated. Now among 2010 and 2011, the ‘Equity’ part is same for both of them. To have a higher ratio value, the ‘commodity’ part should be higher and ‘Fixed Income’ part should be lower. Thus among these two years, we can again eliminate 2011. The following table will give you the approximate value for years 2009 & 2010.
YearCommodityFixedIncomeRatio20090.040.200.2020100.020.160.125
We can see that the ‘commodity’ for 2010 is almost double that of ‘2009’ whereas the ‘fixed income’ part doesn’t have that much variation. Thus 2009 is the answer.
Question 4. In the oral healthcare market, Bolgate and Lipsudent are the market leaders. In the month of March, Bolgate and Lipsudent sold products worth Rs. x and Rs. 1.5x respectively. This value increased by 250% and 100% respectively for the month of April. Among the options given below, which graph depicts this data accurately?
Answer: Option B. -> 2009
:
A
We will first try to represent the data in a tabular format.
MarchAprilBolgatexx+2.5x=3.5xLipsudent1.5x1.5x+1.5x=3x
Now it will be easier to observe that (a) is the correct option.
:
A
We will first try to represent the data in a tabular format.
MarchAprilBolgatexx+2.5x=3.5xLipsudent1.5x1.5x+1.5x=3x
Now it will be easier to observe that (a) is the correct option.
Answer: Option B. -> 18
:
B
Initial pressure = 1 bar
Final pressure =0.1 bar
Time = 5 hrs
Rate of change of pressure =1−1.015 = 0.18 bar/hr
:
B
Initial pressure = 1 bar
Final pressure =0.1 bar
Time = 5 hrs
Rate of change of pressure =1−1.015 = 0.18 bar/hr
Answer: Option B. -> 250%
:
B
Required percentage = (168−48)48×100 = 250%
:
B
Required percentage = (168−48)48×100 = 250%
Answer: Option B. -> 1.428
:
B
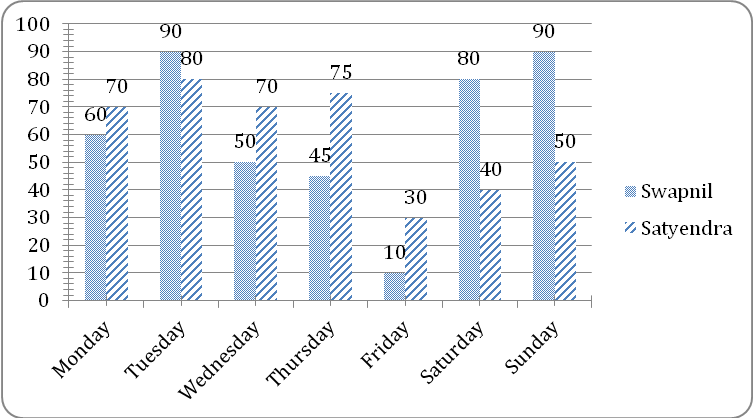
Difference between Swapnil and Satyendra day wise(Swapnil-Satyendra) -
Monday=-10Tuesday=10 Wednesday=-20Thursday=-30Friday=-20Saturday=40Sunday=40
Therefore, -10 + 10 -20 -30 -20 + 40 + 40 = 10
Average = = 1.428 minutes. Swapnil studied 1.428 more minutes per day than Satyendra.
:
B
Difference between Swapnil and Satyendra day wise(Swapnil-Satyendra) -
Monday=-10Tuesday=10 Wednesday=-20Thursday=-30Friday=-20Saturday=40Sunday=40
Therefore, -10 + 10 -20 -30 -20 + 40 + 40 = 10
Average =
 = 1.428 minutes. Swapnil studied 1.428 more minutes per day than Satyendra.
 Answer: Option D. -> Cannot be determined
:
D
We cannot determine. Two ratios are possible 1:2 and 1:4.
:
D
We cannot determine. Two ratios are possible 1:2 and 1:4.
Answer: Option C. -> Products
:
C
In the products category, percentage is increasing with a decreasing rate i.e.
7−33,10−77,11−1010
:
C
In the products category, percentage is increasing with a decreasing rate i.e.
7−33,10−77,11−1010
Answer: Option B. -> Rs 25 lakh
:
B
Interest in 1990-91 = 30% of 130 = Rs 39 lakh
Interest in 1991-92 = 40% of 160 = Rs 64 lakh
∴Difference = (64 – 39) = Rs 25 lakh.
:
B
Interest in 1990-91 = 30% of 130 = Rs 39 lakh
Interest in 1991-92 = 40% of 160 = Rs 64 lakh
∴Difference = (64 – 39) = Rs 25 lakh.


