Question
Answer: Option A
:
C
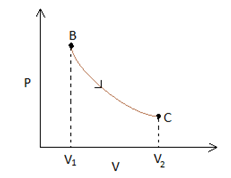
Let us analyse each process separately. BC is an isothermal process, which implies that the P-Cgraph would be represented by a rectangular hyperbola. (Since PV= constant).
This rectangular hyperbola starts at a lower volume V1 and goes to a higher volume as represented in the figure below -

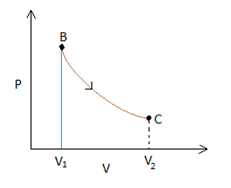
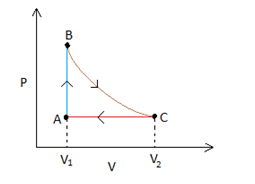
Process AB is an isochoric process, which in a P-Vgraph would be a vertical line. Also we notice that the temperature drops in this process, whichimplies that the pressure will also drop (since PV=nRT, when Vis constant P∝T). Therefore point Acan be anywhere on the line represented in blue in the figure below.

Process C - A
This process is an isobaric process since it represents a curve where V∝T (this is possible only when pressure is a constant, remember Charles' law?). So the process can be represented by a horizontal line in a P-Vgraph. The point where the line joining process A-Band C-Ameet is the point A.

Was this answer helpful ?
:
C
Let us analyse each process separately. BC is an isothermal process, which implies that the P-Cgraph would be represented by a rectangular hyperbola. (Since PV= constant).
This rectangular hyperbola starts at a lower volume V1 and goes to a higher volume as represented in the figure below -
Process AB is an isochoric process, which in a P-Vgraph would be a vertical line. Also we notice that the temperature drops in this process, whichimplies that the pressure will also drop (since PV=nRT, when Vis constant P∝T). Therefore point Acan be anywhere on the line represented in blue in the figure below.
Process C - A
This process is an isobaric process since it represents a curve where V∝T (this is possible only when pressure is a constant, remember Charles' law?). So the process can be represented by a horizontal line in a P-Vgraph. The point where the line joining process A-Band C-Ameet is the point A.
Was this answer helpful ?
More Questions on This Topic :
Question 2. Find the value of ΔU.....
Question 10. The ratio of two specific heats CpCv of CO is ....


Submit Solution