Question
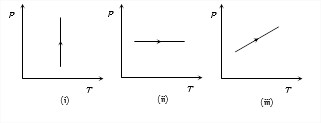
Pressure versus temperature graphs of an ideal gas are as shown in figure. Choose the wrong statement 

Answer: Option C
:
C
(v) μ = PMRT
Density μ remains constant when PT or volume remains constant.
In graph (i) Pressure is increasing at constant temperature hence volume is decreasing so density is increasing. Graphs (ii) and (iii) volume is increasing hence, density is decreasing. Not that
volume whould had been constant in case the stright line in graph (iii) had passed through origin
Was this answer helpful ?


Submit Solution