7th Grade > Mathematics
DATA HANDLING MCQs
:
Each part: 2 Marks
When a die is rolled once, the possible outcomes are 1, 2, 3, 4, 5 and 6
⇒ Total numbers on the dice = 6
(i) Multiples of 2 are 2, 4, 6
⇒ Numbers of Multiples of 2 = 3
Probability of getting a multiple of 2 is
P(E)=Number of multiples of 2Total numbers on the dice
P(E)=36=12
(ii) Prime numbers are 2, 3, 5
⇒ Numbers of Multiples of 2 = 3
Probability of getting a prime number is
P(E)=Number of prime numbersTotal numbers on the dice
P(E)=36=12
A mathematics teacher wanted to see, whether the new technique of teaching she applied after the quarterly test was effective or not. She took the scores of the 5 weak children in the quarterly test (out of 25) and in the half-yearly test (out of 25): [4 MARKS]
StudentsAshishArunKavishMayaRitaQuarterly101512209Half yearly1518162115
Draw a double bar graph. Using the graph answer the following questions.
(i) Is the new technique of teaching effective?
(ii) Who has benefitted more from the new technique?
:
Double bar graph: 2 Marks
Each part: 1 Mark
(i) Double bar graph :
Scale: y axis - 1 cm = 5 units
(i) Every student scored more in the half-yearly than the quarterly.
⇒ New technique of teaching is effective.
(ii) The difference of marks scored by Rita in quarterly and half yearly is maximum.
⇒ Rita has benefitted more from the new technique.
Plot a double bar graph using the given data and answer the following: [4 MARKS]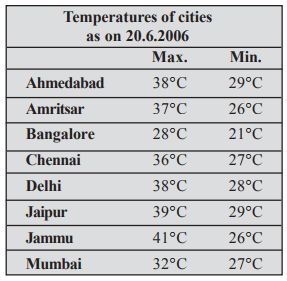
(i) Which city has the largest difference in the minimum and maximum temperature?
(ii) Which is the hottest city and which is the coldest city?
(iii) Name two cities where maximum temperature of one was less than the minimum temperature of the other.
(iv) Name the city which has the least difference between its minimum and the maximum temperature.
:
Drawing double bar graph: 2 Marks
Each part: 0.5 Marks
⇒ Data represented by double bar graph is as follows:
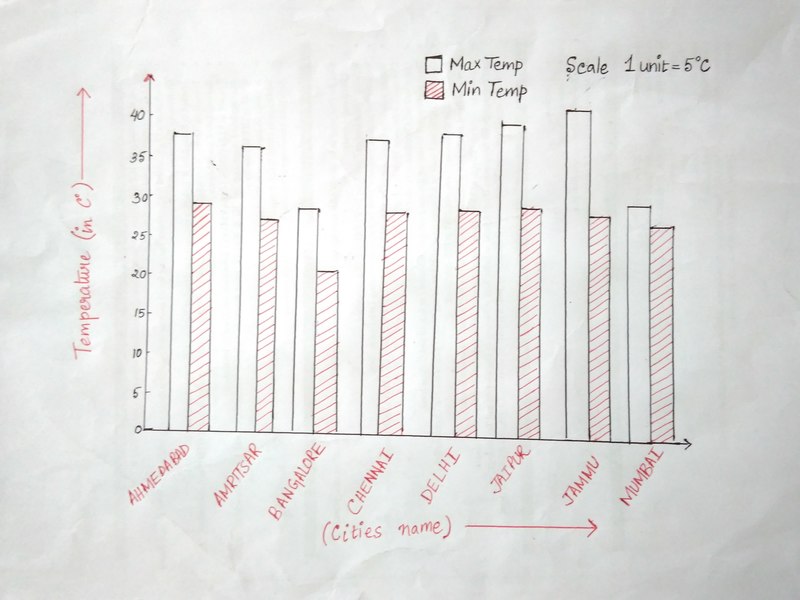
(i) Jammu has the largest difference in temperature i.e., Maximum temperature = 41∘C and Minimum temperature = 26∘C
∴ Difference = 41∘C–26∘C=15∘C
(ii) Jammu is the hottest city as the maximum temperature is the highest among all the given cities and Bangalore is the coldest city because the minimum temperature there is lowest among all the given cities.
(iii) Maximum temperature of Bangalore = 28∘C
Minimum temperature of two cities whose minimum temperature is higher than the maximum temperature of Bangalore are Ahmedabad and Jaipur = 29∘C
(iv) Mumbai has the least difference in temperature i.e., Maximum temperature = 32∘C and Minimum temperature = 27∘C.
∴ Difference = 32∘C–27∘C=5∘C
(i) The birth rate per thousand of different countries over a particular period of time is shown below:
INDIAU.K.CHINAGERMANYSWEDEN352242138
Draw a bar-graph. [4 MARKS]
(ii) A survey of a colony was done. The data is as following:
FavouriteSportCricketBasketBallSwimmingHockeyAthleticsWatching1240470510423250Participating620320320250105
a) Draw a double bar graph choosing an appropriate scale. What do you get from the bar graph?
b) Which sport is most popular?
c) Which is more preferred, watching or participating in sports?
:
Each part: 2 Marks
(i) Scale : x - axis - Countries
y - axis - Birth rate - 1 cm = 5 births
(ii) The given data is represented in a bar graph:
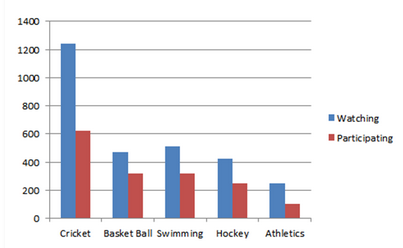
a) The bar graph represents the number of people who are watching and participating in their favourite sports.
b) Cricket is more popular.
c) Watching sports is more preferred.
:
C
Average=Sum of all observationsTotal number of observations
Here, for both the cases, the total number of observations is the same and it is 7.
Average number of villians caught by Batman per day = 2+5+4+1+3+2+47 = 217 = 3.
Average number of villians caught by Superman per day = 3+4+2+2+1+2+07 = 147 = 2.
So, BATMAN's average is higher and it is 3.
:
C
Mode is the observation that occurs the most number of times. Here, 2 and 9 both occur two times. Therefore, they both are modes of the data.
:
A

The heights of the bars that are drawn side by side in the above double bar graph, correspond to the number of men and the number of women who visit the sports complex on each day of the week.
The heights of both the bars are equal on Thursday. So, on Thursday, the numbers of men and women who visited the complex are equal.
:
A
Mean=Sum of all observationsNumber of observations
=12+86+45+78+23+566
=3006
= 50.
Range = Highest observation - Lowest observation
= 86 - 12
= 74
Difference between the mean and range = 74 - 50 = 24
:
B
After arranging the data in ascending order, we get:
0, 3, 8, 12, 15, 19, 23, 24, 39, 53, 57, 64, 65.
Here, n = 13 = Odd
Median=(n+1)2 th observation
=(13+1)2
=7th observation
=23
Therefore, median of the given data is 23.
:
C
If there are 6 faces, the probability of getting one of 6 digits is 16. So, in the case of 8 faces, probability of getting any of the 8 numbers must be 18. Hence, the probability of getting 8 on throwing it is 18.


