Sail E0 Webinar

10th Grade > Mathematics

STATISTICS MCQs

Total Questions : 60 | Page 4 of 6 pages
Question 31.


The median for grouped data is formed by using the formula:


  1.     l+(n2cff ) ×h
  2.     l(n2cff ) ×h.
  3.     l+(n2+cff ) ×h.
  4.     l+2n
 Discuss Question
Answer: Option A. -> l+(n2cff ) ×h
:
A

The median for grouped data is formed by l+(n2cff ) ×h.


Where l is lower class limit of median class.
          n is total number of observations.
          cf is the cumulative frequency of the class preceding the median class.
          f is the frequency of the median class and h is the class size.


Question 32.


The following data shows monthly savings of 100 families . Calculate the mode of the given frequency distribution.


        Monthly savings(Rs)                Number of families        10002000142000300015300040002140005000275000600025


  1.     4790
  2.     4760
  3.     4750
  4.     4780
 Discuss Question
Answer: Option C. -> 4750
:
C

Modal class is 4000-5000 within


f1 = 27, f0 = 21, f2 = 25, I = 4000, h = 1000


Mode = l + f1f02f1f0f2×h


Mode = 4000 + 68×1000


          = 4750


Question 33.


Find the mode of the following data.


Class interval0100100200200300300400400500Frequency7111598   


___
 Discuss Question
Answer: Option C. -> 4750
:

 Modal Class is 200-300


Mode=I+(f1f02f1f0f2)×h


=200+151130119×100=240


Question 34.


The below table shows that profit made by a group of shops in mall. Then the median is _____.


Profit per shop less than (%)102030405060No. of shops1230577794100


  1.     27.4
  2.     31.2
  3.     26.8
  4.     23.7
 Discuss Question
Answer: Option A. -> 27.4
:
A

Firstly, the cumulative frequency (CF) table is drawn.


C.ICFFrequency01012121020301820305727304077204050941750601006Total100


n2=1002=50


C.F  nearest to 50 and greater than 50 is 57.


 Median=l+(n2cff)×h
Where l is lower class limit of median class.
          n is total number of observations.
          cf is the cumulative frequency of the class preceding the median class.
          f is the frequency of the median class and h is the class size.
Median=20+(503027)×10


Median = 27.4


Question 35.


In the assumed mean method, if A is the assumed mean, then deviation di is : 


  1.     xiA
  2.     xi+A
  3.     xi
  4.     Axi
 Discuss Question
Answer: Option A. -> xiA
:
A
The deviation is di=xiA
Question 36.


The times (in seconds) taken by 150 athelets to run a 110 m hurdle race are tabulated below


Class13.8141414.214.214.414.414.614.614.814.815Frequency245714820


The number  of atheletes who completed the race in less than 14.6 s is


  1.     11
  2.     71
  3.     82
  4.     130
 Discuss Question
Answer: Option C. -> 82
:
C

The number of atheletes who completed the race in less than 14.6


= 2 + 4 + 5 + 71


= 82


Question 37.


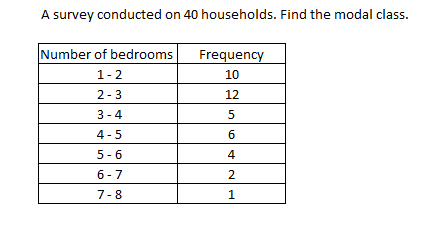
  1.      1 - 2
  2.     2 - 3
  3.      6 - 7 
  4.      7 - 8
 Discuss Question
Answer: Option B. -> 2 - 3
:
B
Here we locate a class with the maximum frequency. From the given table we find the maximum frequency as 12 whose class is 2 - 3. Therefore the modal class is 2 - 3.
Question 38.


In the assumed mean method, if A is the assumed mean, then deviation di is : 


  1.     xiA
  2.     xi+A
  3.     xi
  4.     Axi
 Discuss Question
Answer: Option A. -> xiA
:
A

 In statistics, 'the assumed mean' is a method for calculating the arithmetic mean and standard deviation of a data set. It simplifies calculating accurate values by hand.


During the application of the short-cut method for finding the mean, the deviation d, are divisible by a common number ‘h’. In this case, the di = xi – A is reduced to a great extent as 'di' becomes dih. In this method, we divide the deviations by the same number to simplify calculations. The deviation is di=xiA


Question 39.


The following table gives the life time of 200 neon lamps. Find the median class.
The Following Table Gives The Life Time Of 200 Neon Lamps. F...


  1.     2500 - 3000
  2.     1000 - 1500
  3.     1500 - 2000
  4.     3000 - 3500
 Discuss Question
Answer: Option A. -> 2500 - 3000
:
A
The Following Table Gives The Life Time Of 200 Neon Lamps. F...
The median class is identified as the class whose cumulative frequency  will be greater than n2, where 'n' is the sum of  the frequencies. (n=200).
Next, we divide 200 by 2.
n2=2002=100
We now locate the class whose cumulative frequency is greater than 100.
"2500 - 3000" is the class whose cumulative frequency 155 is greater than 100.
The median class is 2500 - 3000.
Question 40.


For which data set, the mean is not a good representative measures of central tendency.


  1.     There are 7 classes with the below frequencies.
    {10, 12, 15, 17, 14, 15, 17}
  2.     There are 6 classes with the below frequencies.
    {2, 20, 25, 17, 19, 22}
  3.     There are 7 classes with the below frequencies.
    {5, 7, 5, 6, 4, 5, 7}
  4.     There are 6 classes with the below frequencies.
    {17, 20, 25, 17, 19, 22}
 Discuss Question
Answer: Option B. -> There are 6 classes with the below frequencies.
{2, 20, 25, 17, 19, 22}

:
B
We know that extreme values in the data affect the mean. Here only for the data set {2, 20, 25, 17, 19, 22}, we find the extreme value as one class has the frequency as 2 and the others have frequency 20, 25, 17, 19 and 22.

Latest Videos

Latest Test Papers