Question
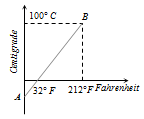
The graph AB shown in figure is a plot of temperature of a body in degree Celsius and degree Fahrenheit. Then


Answer: Option B
:
B
Relation between Celsius and Fahrenheit scale of temperature is C5=F−329
By rearranging we get, C = 59F−1609
By equating above equation with standard equation of line y=mx+c we get m=59 and c=−1609
i.e. Slope of the line AB is 59.
Was this answer helpful ?
:
B
Relation between Celsius and Fahrenheit scale of temperature is C5=F−329
By rearranging we get, C = 59F−1609
By equating above equation with standard equation of line y=mx+c we get m=59 and c=−1609
i.e. Slope of the line AB is 59.
Was this answer helpful ?


Submit Solution