Question
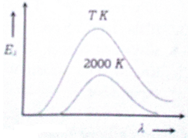
The adjoining diagram shows the spectral energy density distribution Eλ of a black body at two different temperatures. If the areas under the curves are in the ratio 16 : 1, find the value of temperature T.

Answer: Option B
:
B
Area under curve represents the emissive power of the body
ETE2000=ATA2000=161 (given) ...(i)
But from Stefan's law E α T4
∴ETE2000=(T2000)4 ...(ii)
From (i) and (ii) (T2000)4=161
⇒T2000=2⇒T=4000k.
Was this answer helpful ?
:
B
Area under curve represents the emissive power of the body
ETE2000=ATA2000=161 (given) ...(i)
But from Stefan's law E α T4
∴ETE2000=(T2000)4 ...(ii)
From (i) and (ii) (T2000)4=161
⇒T2000=2⇒T=4000k.
Was this answer helpful ?


Submit Solution