Question
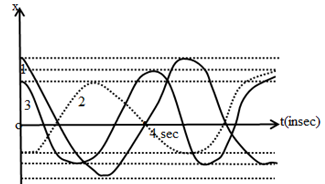
Graph shows the x(t) curves for three experiments involving a particular spring-block system oscillating in SHM. The kinetic energy of the system is maximum at t=4 sec, for the situation:

Answer: Option B
:
B
Among these given graphs we need to figure out which has maximum K.E. at 4 seconds. Not a big deal! Let's just think through. Since the three experiments involve the same spring block system so the spring constant remains same for all. Now only (1) and (2) are in their mean position at t = 4 and (3) is in extreme so we can rule out (3). In the mean position K.E = T.E = 12KA2. Among (1) and (2), (1) has higher value of A(amplitude)
which we can see from the height it's bump!. So (1) has the maximum K.E.
Alternative way of thinking could be
Since this is a displacement - time graph and dxdtmeans velocity so the slope of this graph gives velocity.
More slope ⇒ more velocity ⇒ more K.E. Among (1) (2) and (3), (1) has the maximum slope (by observation) and so maximum K.E.
Was this answer helpful ?


Submit Solution