Question
Answer: Option C
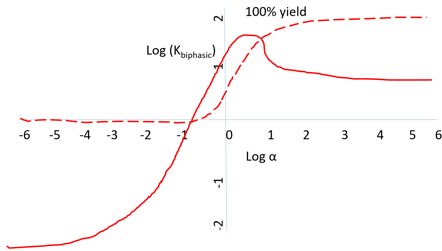
Answer: (c).Variation in the apparent equilibrium constant and percentage yield
Was this answer helpful ?
Answer: (c).Variation in the apparent equilibrium constant and percentage yield
Was this answer helpful ?
More Questions on This Topic :
Question 1. What does the plot in the diagram depict?....
Question 3. What does the diagram depict?....


Submit Solution