Question
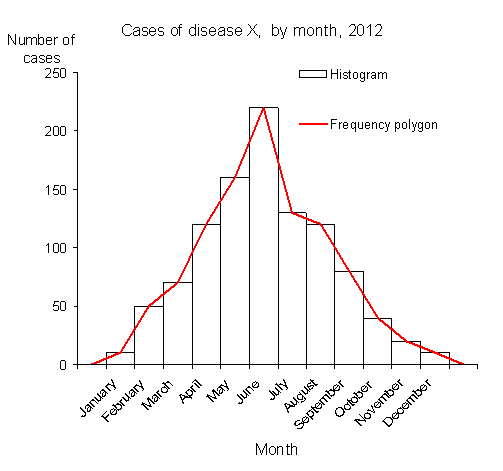
The following figure shows a histogram and corresponding frequency polygon. The data shows the number of victims suffering from a disease 'X' in various months of 2012. 
Identify the correct statement(s) among the following.
Answer: Option A
:
A and C
From the definition, the area under frequency polygon is same as the sum of the areas of all the bars of the histogram provided the class size of all classes is the same. Hence option A is correct.
Also, we can see that the bar of February is not the smallest. Hence, option B is incorrect.
The bar of June is highest, so option C is correct.
Also, the frequency polygon is correctly drawn joining all the class marks and starting and ending at 0 so option D is not correct.
Was this answer helpful ?


Submit Solution