Question
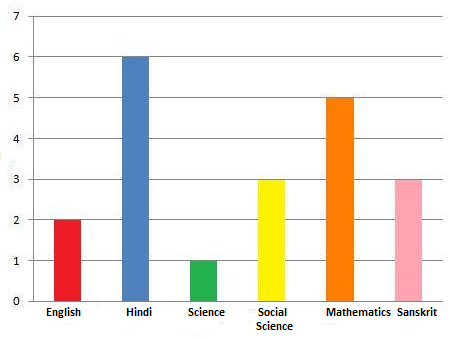
The bar graph shows the favourite subjects of 20 students in class VI 'B'. How many more of them prefer Mathematics to Science?
FAVOURITE SUBJECTS OF 20 STUDENTS

Here the horizontal axis is x axis which represents subjects and vertical axis is y axis which represents number of students. x axis represents subjects and the scale y axis 1 cm = 1 student.
FAVOURITE SUBJECTS OF 20 STUDENTS
Here the horizontal axis is x axis which represents subjects and vertical axis is y axis which represents number of students. x axis represents subjects and the scale y axis 1 cm = 1 student.
Answer: Option C
:
C
5 of them prefermathematics and only one preferscience.
So,5 - 1 = 4
Therefore mathematics is preferred by 4 more students than science.
Was this answer helpful ?
:
C
5 of them prefermathematics and only one preferscience.
So,5 - 1 = 4
Therefore mathematics is preferred by 4 more students than science.
Was this answer helpful ?


Submit Solution