Question
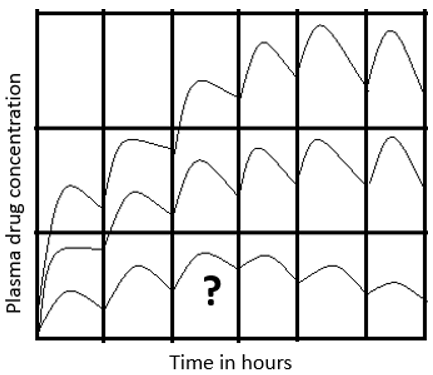
In the given picture of a graph plotted between the plasma concentration versus time, the marked curve is for which kind of dosage?

Answer: Option C
Answer: (c).Smaller dose
Was this answer helpful ?
Answer: (c).Smaller dose
Was this answer helpful ?


Submit Solution