Question
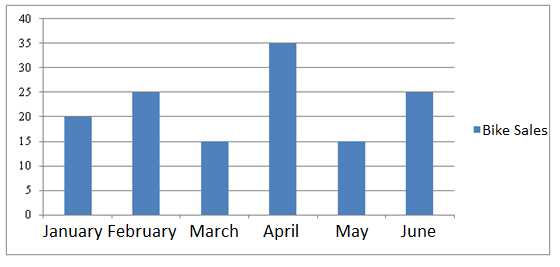
In the bar chart below, you have the sales of bikes from ABC company. What is the difference of sales in April and June?
Here the horizontal axis is x-axis which represents months and vertical axis is y-axis which represents number of bikes sold. The scale for x axis is 1 cm = 1 month and y-axis 1 cm = 5 bikes.

Here the horizontal axis is x-axis which represents months and vertical axis is y-axis which represents number of bikes sold. The scale for x axis is 1 cm = 1 month and y-axis 1 cm = 5 bikes.

Answer: Option A
:
A
The height of the bar graph represents the sales in a month.
∴ Sales in April =35 units.
Sales in June =25 units.
So, the difference =35−25=10 units.
∴ Difference in sales=10×5=50
Was this answer helpful ?
:
A
The height of the bar graph represents the sales in a month.
∴ Sales in April =35 units.
Sales in June =25 units.
So, the difference =35−25=10 units.
∴ Difference in sales=10×5=50
Was this answer helpful ?


Submit Solution