Sail E0 Webinar

MCQs

Total Questions : 129 | Page 2 of 13 pages
Question 11. ______ zone lies between Euphotic and Benthic zone.
  1.    Euphotic zone
  2.    Benthic zone
  3.    Littoral zone
  4.    Climate zone
 Discuss Question
Answer: Option C. -> Littoral zone
Answer: (c).Littoral zone
Question 12. _______ is the process of overgrowth of plants and algae in lakes.
  1.    Transpiration
  2.    Reproduction
  3.    Eutrophication
  4.    Photosynthesis
 Discuss Question
Answer: Option C. -> Eutrophication
Answer: (c).Eutrophication
Question 13. Which of the following promotes eutrophication of lakes?
  1.    Magnesium
  2.    Sodium
  3.    Calcium
  4.    Phosphorous
 Discuss Question
Answer: Option D. -> Phosphorous
Answer: (d).Phosphorous
Question 14. The uppermost zone in lakes is called as ____________
  1.    Euphotic zone
  2.    Benthic zone
  3.    Littoral zone
  4.    Climate zone
 Discuss Question
Answer: Option A. -> Euphotic zone
Answer: (a).Euphotic zone
Question 15. In which zone, decomposition of the dead organism takes place?
  1.    Climate zone
  2.    Benthic zone
  3.    Littoral zone
  4.    Euphotic zone
 Discuss Question
Answer: Option B. -> Benthic zone
Answer: (b).Benthic zone
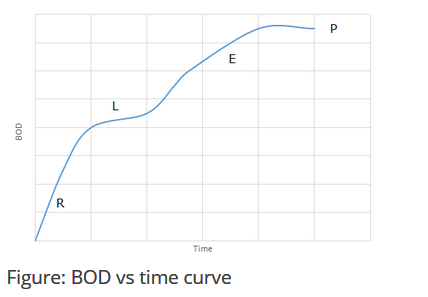
Question 16. The nitrogenous demand begins after how many days?The Nitrogenous Demand Begins After How Many Days?
  1.    1
  2.    2
  3.    3
  4.    5
 Discuss Question
Answer: Option D. -> 5
Answer: (d).5
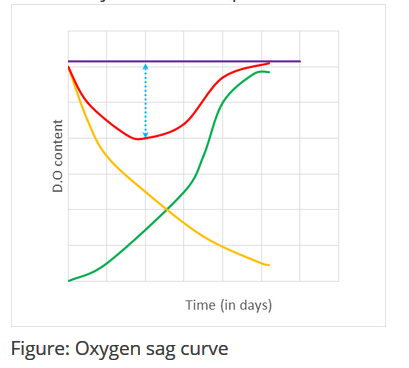
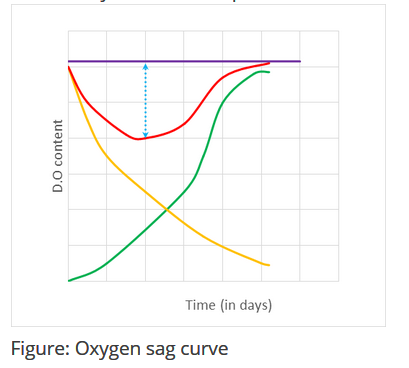
Question 17. Which of the following is represented by the green curve in the following figure?Which Of The Following Is Represented By The Green Curve In ...
  1.    Deoxygenation curve
  2.    Reoxygenation curve
  3.    Oxygen sag curve
  4.    Equilibrium concentration of oxygen
 Discuss Question
Answer: Option B. -> Reoxygenation curve
Answer: (b).Reoxygenation curve
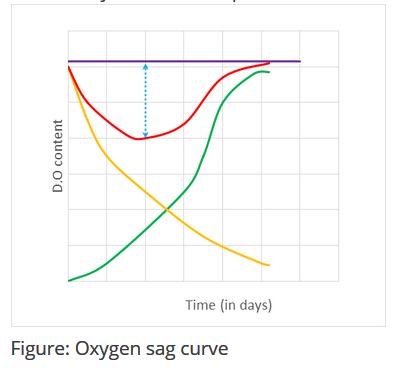
Question 18. What is yellow curve represents in the following figure?What Is Yellow Curve Represents In The Following Figure?
  1.    Deoxygenation curve
  2.    Reoxygenation curve
  3.    Oxygen sag curve
  4.    Equilibrium concentration of oxygen
 Discuss Question
Answer: Option A. -> Deoxygenation curve
Answer: (a).Deoxygenation curve
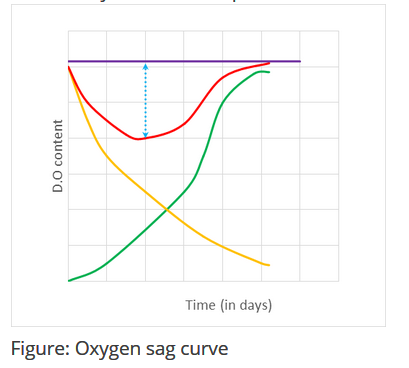
Question 19. Which of the following represents the oxygen sag curve in the following figure?Which Of The Following Represents The Oxygen Sag Curve In Th...
  1.    Dotted blue line
  2.    Green curve
  3.    Yellow curve
  4.    Red curve
 Discuss Question
Answer: Option D. -> Red curve
Answer: (d).Red curve
Question 20. The maximum deficiency of dissolved oxygen is represented by ____________The Maximum Deficiency Of Dissolved Oxygen Is Represented By...
  1.    Dotted blue line
  2.    Green curve
  3.    Yellow curve
  4.    Violet curve
 Discuss Question
Answer: Option A. -> Dotted blue line
Answer: (a).Dotted blue line

Latest Videos

Latest Test Papers