Question
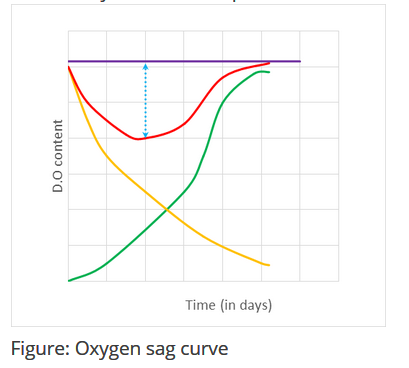
Answer: Option D
Answer: (d).Red curve
Was this answer helpful ?
Answer: (d).Red curve
Was this answer helpful ?
More Questions on This Topic :
Question 8. Which color indicates the fresh sewage?....
Question 9. The color of the septic sewage is __________....


Submit Solution