Sail E0 Webinar

4th Grade > Mathematics

DATA HANDLING MCQs

Total Questions : 40 | Page 4 of 4 pages
Question 31.


Representation of data as rectangular bars with different lengths is called:


  1.     Bar graph
  2.     Pictograph
  3.     Data
  4.     Scale
 Discuss Question
Answer: Option A. -> Bar graph
:
A

A bar graph is a graph that presents data with rectangular bars with heights or lengths proportional to the values that they represent.  


Question 32.


The initial data collected which is not organised is called:


  1.     Bar graph
  2.     Grouped data
  3.     Raw data
  4.     Graph
 Discuss Question
Answer: Option C. -> Raw data
:
C

Raw data is data collected from one or many sources. It is data that has not been organised. It needs to be organised so that it can be used.


Question 33.


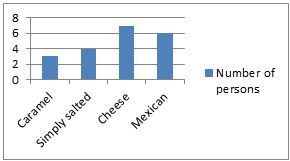
The figure shows the preferred flavour of popcorn among 20 persons.
The Figure Shows The Preferred Flavour Of Popcorn Among 20 P... 
How many people don’t have caramel as the favourite?


  1.     18
  2.     17
  3.     15
  4.     16
 Discuss Question
Answer: Option B. -> 17
:
B

The Figure Shows The Preferred Flavour Of Popcorn Among 20 P...


On observing the bar graph, we see that
Total number of people who took the survey = (3 + 4+ 7+ 6) = 20
Number of people who like caramel flavour = 3
Number of people who don't prefer caramel flavoured popcorn =203=17


Question 34.


Height of 12 boys (in cm) are :
143,144,141,145,147,144,142,145,149,151,147,143


 What is the frequency of boys with a height of 143 cm?


  1.     2
  2.     3
  3.     4
  4.     1
 Discuss Question
Answer: Option A. -> 2
:
A

Arranging the heights of 12 boys in ascending order we get
141,142,143,143,144,144,145,145,147,147,149,151
The number of times a particular value of data occurs is known as frequency.
Here, we see there are 2 boys with height 143 cm.
Therefore, the frequency of boys with a height of 143 cm is 2.


Question 35.


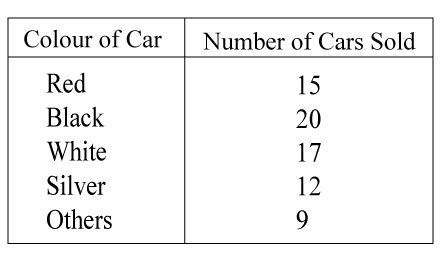
What is the sum of black coloured and white coloured cars sold?
What Is The Sum Of Black Coloured And White Coloured Cars So...


  1.     32
  2.     37
  3.     17
  4.     33
 Discuss Question
Answer: Option B. -> 37
:
B

On observing the table we see,
Number of black cars sold = 20
Number of white cars sold = 17


∴ Total number of black and white cars sold = 20+17=37 cars


Question 36.


Find the frequency of  symbol ‘-’:
 ×, ×, ÷, -, ×, +, +, ÷, ×, +, -, +, +, -, ÷, ×


  1.     1
  2.     2
  3.     3
  4.     4
 Discuss Question
Answer: Option C. -> 3
:
C

The number of times a particular value of data occurs is known as frequency. 
 ×, ×, ÷, -, ×, +, +, ÷, ×, +, -, +, +, -, ÷, ×
Here, we observed that symbol  '-' is occurring thrice, therefore the frequency of '-' symbol is 3.


Question 37.


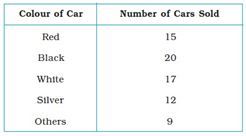
If others include 3 orange cars, 4 green cars and 2 purple cars, what is the difference between the number of red cars sold and number of green cars sold? 
If Others Include 3 Orange Cars, 4 Green Cars And 2 Purple C...


  1.     10
  2.     15
  3.     11
  4.     4
 Discuss Question
Answer: Option C. -> 11
:
C

On observing the data,
Given: Red cars = 15
           Green cars = 4


Difference between red cars sold and green cars = 154=11 cars


Question 38.


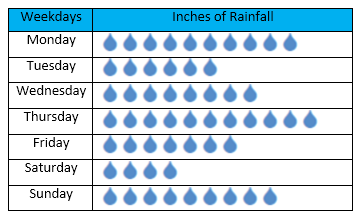
The daily rainfall data recorded in a week is shown below. What is the total rainfall recorded on Thursday? (1 drop = 4 inches of rain) 
The Daily Rainfall Data Recorded In A Week Is Shown Below. W...


  1.     46 inches
  2.     42 inches
  3.     44 inches
  4.     34 inches
 Discuss Question
Answer: Option C. -> 44 inches
:
C

Given:
1 drop = 4 inches of rain
Rainfall recorded on Thursday = 11 drops
Therefore, the number of inches of rain on Thursday = 4×11=44 inches


Question 39.


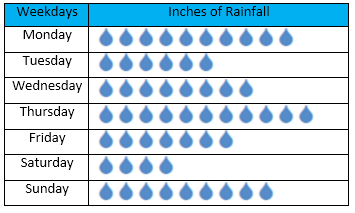
The daily rainfall data recorded in a week is shown below. On which day of the week is the rainfall the highest? (1 drop = 1 inch rainfall)
The Daily Rainfall Data Recorded In A Week Is Shown Below. O...


  1.     Monday
  2.     Thursday
  3.     Sunday
  4.     Both Sunday and Monday
 Discuss Question
Answer: Option B. -> Thursday
:
B

By observing the graph, (1 drop = 1 inch)
Rainfall recorded on Monday = 10 inches
Rainfall recorded on Tuesday = 06 inches
Rainfall recorded on Wednesday = 08 inches
Rainfall recorded on Thursday = 11 inches
Rainfall recorded on Friday = 07 inches
Rainfall recorded on Saturday = 04 inches
Rainfall recorded on Sunday = 09 inches
From above , we can see that Thursday had the heaviest rainfall.


Question 40.


Number of columns in the table given below is ______.
              ItemQuantityPen25Pencil30Eraser18Sharpner21


  1.     5
  2.     2
  3.     10
  4.     4
 Discuss Question
Answer: Option B. -> 2
:
B
Data written vertically are called columns. Here, there are two vertical datas present under the name Item and Quantity. Thus, there are two columns present in the given table.

Latest Videos

Latest Test Papers