Sail E0 Webinar

4th Grade > Mathematics

DATA HANDLING MCQs

Total Questions : 40 | Page 3 of 4 pages
Question 21.


Data available in unorganized form is called :


  1.     Bar graph
  2.     Raw data
  3.     Information
  4.     Organised data
 Discuss Question
Answer: Option B. -> Raw data
:
B

Raw data is the data that has not been organised well enough for use.
Example:
Given below are the marks (out of 25) obtained by 10 students of class (V A) in mathematics in a test.
18, 16, 12, 10, 5, 5, 4, 19, 20, 10


Question 22.


A graph that presents data with rectangular bars with heights or lengths proportional to the values that they represent is :


  1.     Bar Graph
  2.     Pie Chart
  3.     Pictograph
  4.     Raw data
 Discuss Question
Answer: Option A. -> Bar Graph
:
A

A bar graph is a graph that presents data with rectangular bars having heights or lengths showing the values that they represent.


Question 23.


The temperature of a certain place, recorded for ten days (in C) is as follows:6,8,0,3,2,0,1,5,4,4


How many days had a temperature of less than 4C?


  1.     4
  2.     3
  3.     2
  4.     5
 Discuss Question
Answer: Option D. -> 5
:
D

Arranging the data in ascending order, we get, 0,0,1,2,3,4,4,5,6,8.
On observing, there are 5 days(0,0,1,2,3) that had a temperature of less than 4° C.


Question 24.


Find the frequency of "K"in the given data set: 
K, J, F, J, A, J, N, S, A, J, A, W, P, J, A, H, A, P, O, W, J, K, Z.


  1.     1
  2.     2
  3.     3
  4.     4
 Discuss Question
Answer: Option B. -> 2
:
B

The number of times a particular value of data occurs is known as frequency. 
Here, in the given data set:
K, J, F, J, A, J, N, S, A, J, A, W, P, J, A, H, A, P, O, W, J, K, Z.


we observe that K is occurring twice, therefore the frequency of K is 2.


Question 25.


In a bar graph, the distance between two bars may not be the same. 


  1.     False
  2.     True
  3.     3
  4.     4
 Discuss Question
Answer: Option A. -> False
:
A

In a bar graph, we follow these rules
1)The width of the bars should be uniform throughout.
2)The gap between one bar and another should be equal throughout.


Question 26.


Find the frequency of symbol ‘+’:
 ×, ×, ÷, -, ×, +, +, ÷, ×, +, -, +, +, -, ÷, ×


  1.     3
  2.     4
  3.     5
  4.     6
 Discuss Question
Answer: Option C. -> 5
:
C

The number of times a particular value of data occurs is known as frequency. 


Given:
×, ×, ÷, -, ×, +, +, ÷, ×, +, -, +, +, -, ÷, ×


We observe that the '+' symbol is occurring 5 times and therefore the frequency of + is 5.


Question 27.


The number of members in 20 families are given as follows:
 4,6,5,5,4,6,3,3,5,5,3,5,4,4,6,7,3,5,5,7


How many families have less than 5 members?


  1.     7
  2.     8
  3.     6
  4.     5
 Discuss Question
Answer: Option B. -> 8
:
B

4, 6, 5, 5, 4, 6, 3, 3, 5, 5, 3, 5, 4, 4, 6, 7, 3, 5, 5, 7


Here, we see the number of families with 3 members is 4 and with 4 members is also 4.
So, the number of families with less than 5 members is 8.


Question 28.


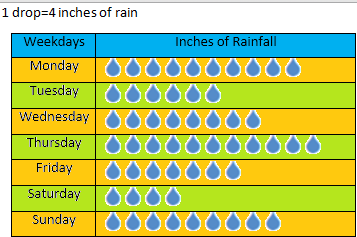
The daily rainfall data of a week is shown below. What is the total amount of rainfall on Wednesday? (1 drop = 2 inches of rain)
The Daily Rainfall Data Of A Week Is Shown Below. What Is Th...


  1.     36 inches
  2.     16 inches
  3.     32 inches
  4.     20 inches
 Discuss Question
Answer: Option B. -> 16 inches
:
B

Given:
1 drop = 2 inches 
Wednesday = 8 drops of rain


Therefore, inches of rain on Wednesday =2×8=16 inches


Question 29.


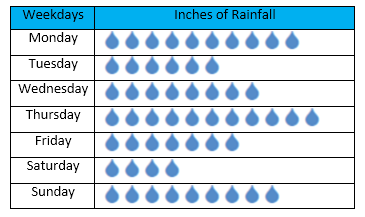
The daily rainfall data of a week is shown. What is the total rainfall on Saturday and Sunday?
The Daily Rainfall Data Of A Week Is Shown. What Is The Tota...


  1.     56 inches
  2.     52 inches
  3.     68 inches
  4.     64 inches
 Discuss Question
Answer: Option B. -> 52 inches
:
B

Given:
1 drop = 4 inches of rain


Number of drops on Saturday = 4 drops
Number of drops on Sunday = 9 drops
Therefore inches of rain on Saturday and Sunday
=(4+9)×4
=13×4=52 inches


Question 30.


Number of rows in the table given below is ______.
            ItemQuantityRasagulla25Gulab jamun30Ladoo18Vanilla cake21


  1.     2
  2.     5
  3.     10
  4.     8
 Discuss Question
Answer: Option B. -> 5
:
B
Data written horizontally are called rows. 
From this table, we figure out that 4 different sweet items are given with 1 row for the header.
Thus, there are totally five rows present in the given table.

Latest Videos

Latest Test Papers