Question

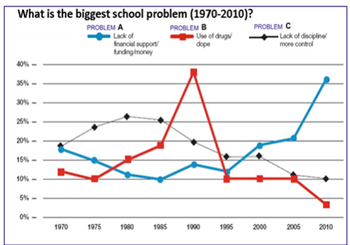
Use the line graph given here to solve the question: Among the options given, the combined percentage contribution of ‘Problem A’ and ‘Problem B’ towards ‘Biggest School problem’ is least for the year?

Use the line graph given here to solve the question: Among the options given, the combined percentage contribution of ‘Problem A’ and ‘Problem B’ towards ‘Biggest School problem’ is least for the year?
Answer: Option B
:
B
1970 = 12+18 = 30%
1975 = 10+15 = 25%
1985 = 10+19 = 29%
2005 = 10 +21= 31%
Was this answer helpful ?
:
B
1970 = 12+18 = 30%
1975 = 10+15 = 25%
1985 = 10+19 = 29%
2005 = 10 +21= 31%
Was this answer helpful ?


Submit Solution