Question
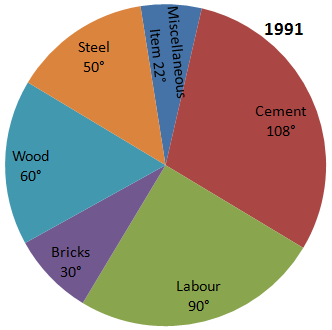
Directions (1 - 3): Pie-charts show the expenses on various heads show the expenses on various heads in construction of a house. Study the pie-chart.

The percentage increase in the amount spent on labour from 1991 to 2001, given that the total amount spent on the construction of the house is Rs. 360000 in 1991 and Rs. 864000 in 2001 is:

The percentage increase in the amount spent on labour from 1991 to 2001, given that the total amount spent on the construction of the house is Rs. 360000 in 1991 and Rs. 864000 in 2001 is:
Answer: Option D
$$\eqalign{
& {\text{Expenditure on labourers:}} \cr
& {\text{Year }}1991 = \frac{{360000 \times 90°}}{{360°}} \cr
& \,\,\,\,\,\,\,\,\,\,\,\,\,\,\,\,\,\,\,\,\,\,\,\,\,\,\, = {\text{Rs. }}90000 \cr
& {\text{Year }}2001 = \frac{{864000 \times 100°}}{{360°}} \cr
& \,\,\,\,\,\,\,\,\,\,\,\,\,\,\,\,\,\,\,\,\,\,\,\,\,\,\, = {\text{Rs. }}240000 \cr
& {\text{Percentage increase}} \cr
& = \frac{{240000 - 90000}}{{90000}} \times 100 \cr
& = 166\frac{2}{3}\% \cr} $$
Was this answer helpful ?
More Questions on This Topic :
Question 4. Total expenditure on conveyance is?....


Submit Solution