Question
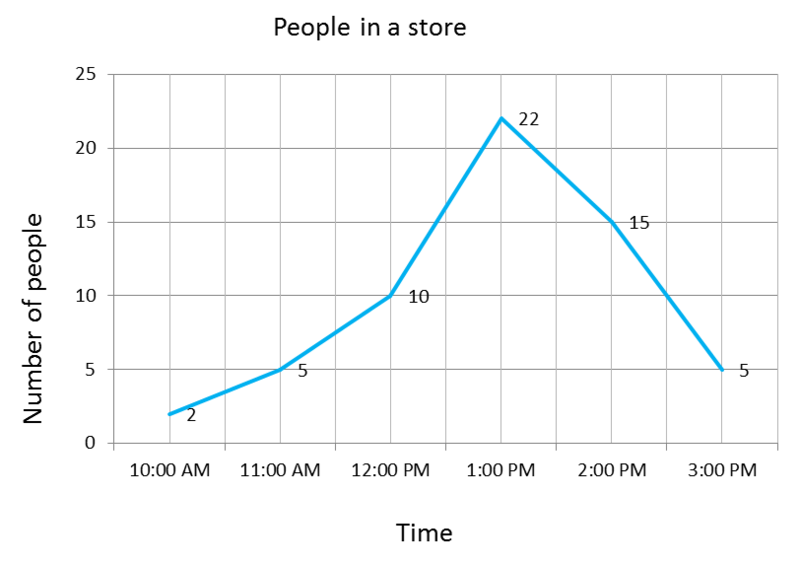
The line graph below shows people in a store at various times of the day. How many people are there in the store at 2:30 pm?


Answer: Option C
:
C
In the figure, the x-axis represents the time and y-axis represents the number of people. In a line graph, the value of datum at any point can be found using the line. The time 2:30 pm is exactly halfway between 2 and 3 pm. The number of people is on the y-axis corresponding to the point between that at 2 and 3. Halfway between 5 and 15 on a number line is 10. Hence the number of people at 2:30 pm are 10.
Was this answer helpful ?
More Questions on This Topic :
Question 7. A bar graph is used to show ____________.....


Submit Solution