Question
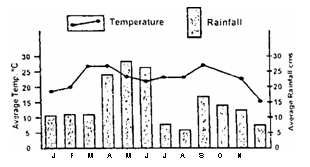
The graph given below shows the mean average monthly temperatures (in °C) and mean monthly rainful (in cms) of a place :

The graph is indicative of which one of the climatic zones of the world ?

The graph is indicative of which one of the climatic zones of the world ?
Answer: Option A
:
A
Ans. (a)
Explanation
As the graph indicates average temperature range 15-25°C and average rainfall range also 15-25 cm not exceeding 30 cm and heaviest rainfall in May, June months, it is wet and dry tropical climate zone of the world.
Was this answer helpful ?
:
A
Ans. (a)
Explanation
As the graph indicates average temperature range 15-25°C and average rainfall range also 15-25 cm not exceeding 30 cm and heaviest rainfall in May, June months, it is wet and dry tropical climate zone of the world.
Was this answer helpful ?


Submit Solution