Question
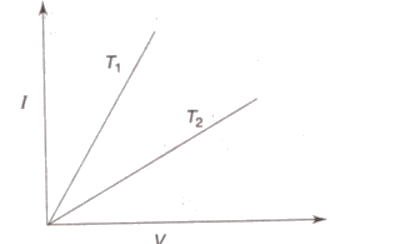
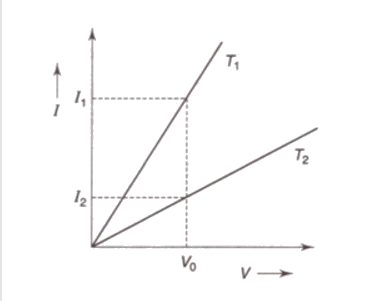
The current voltage (I – V) graphs for a given metallic wire at two different temperatures T1 and T2 are shown in figure. If follows from the graphs that


Answer: Option B
:
B

It is clear from figure that at a given voltage V0 the current I1 in the wire at temperature T1is greater than the current I2 in the wire at temperature T2, Therefore the resistance of the wire at temperature T1 is less than that of temperature T2. This can happen if T1 is less than T2because the resistance of wire increases with increase in temperature
Was this answer helpful ?
:
B

It is clear from figure that at a given voltage V0 the current I1 in the wire at temperature T1is greater than the current I2 in the wire at temperature T2, Therefore the resistance of the wire at temperature T1 is less than that of temperature T2. This can happen if T1 is less than T2because the resistance of wire increases with increase in temperature
Was this answer helpful ?


Submit Solution