Question
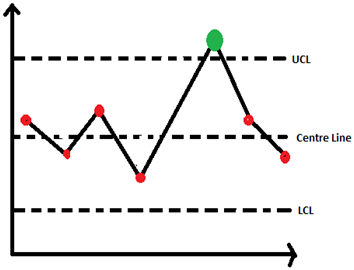
Let the X-axis and Y-axis represent sample numbers and any quality characteristic value respectively. What does the ‘green color data point’ represent?

Answer: Option A
Answer: (a).Out-of-control sample value
Was this answer helpful ?
Answer: (a).Out-of-control sample value
Was this answer helpful ?


Submit Solution