Question
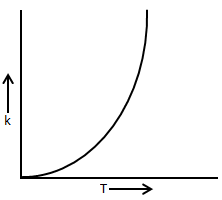
Plots showing the variation of the rate constant (k) with temperature (T) are given below. The plot that follows the Arrhenius equation is
More Questions on This Topic :
Question 4. The half life of a first order reaction is....


Submit Solution