Sail E0 Webinar

Reasoning Aptitude > Data Interpretation

TABULATION MCQs

Table Charts

Total Questions : 185 | Page 1 of 19 pages
Question 1. Study the following table and answer the question based on it.
What is the average amount of interest per year which the company had to pay during this period?Study The Following Table And Answer The Question Based On I...
  1.    Rs. 32.43 lakhs
  2.    Rs. 33.72 lakhs
  3.    Rs. 34.18 lakhs
  4.    Rs. 36.66 lakhs
 Discuss Question
Answer: Option D. -> Rs. 36.66 lakhs
Answer: (d).Rs. 36.66 lakhs
Question 2. Study the following table and answer the question based on it.
The total amount of bonus paid by the company during the given period is approximately what percent of the total amount of salary paid during this period?Study The Following Table And Answer The Question Based On I...
  1.    0.1%
  2.    0.5%
  3.    1%
  4.    1.25%
 Discuss Question
Answer: Option C. -> 1%
Answer: (c).1%
Question 3. Study the following table and answer the question based on it.
Total expenditure on all these items in 1998 was approximately what percent of the total expenditure in 2002?Study The Following Table And Answer The Question Based On I...
  1.    62%
  2.    66%
  3.    69%
  4.    71%
 Discuss Question
Answer: Option C. -> 69%
Answer: (c).69%
Question 4. Study the following table and answer the question based on it.
The total expenditure of the company over these items during the year 2000 is?Study The Following Table And Answer The Question Based On I...
  1.    Rs. 544.44 lakhs
  2.    Rs. 501.11 lakhs
  3.    Rs. 446.46 lakhs
  4.    Rs. 478.87 lakhs
 Discuss Question
Answer: Option A. -> Rs. 544.44 lakhs
Answer: (a).Rs. 544.44 lakhs
Question 5. Study the following table and answer the question based on it.
The ratio between the total expenditure on Taxes for all the years and the total expenditure on Fuel and Transport for all the years respectively is approximately?Study The Following Table And Answer The Question Based On I...
  1.    4:7
  2.    10:13
  3.    15:18
  4.    5:8
 Discuss Question
Answer: Option B. -> 10:13
Answer: (b).10:13
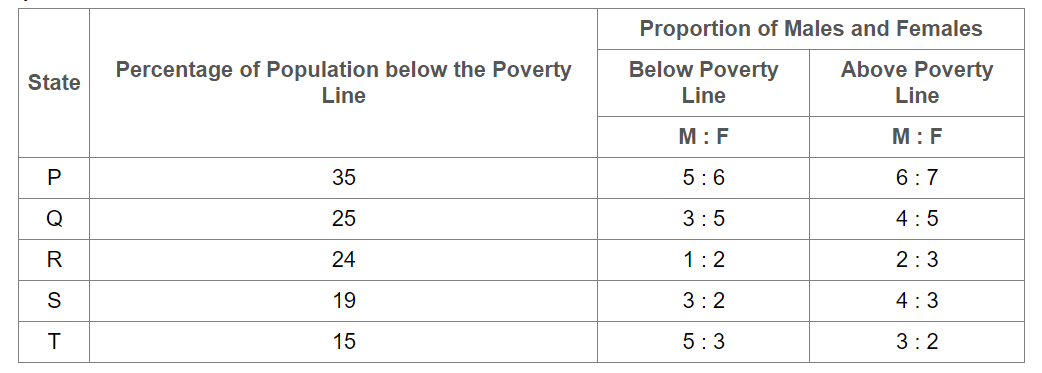
Question 6. The following table gives the percentage distribution of population of five states, P, Q, R, S and T on the basis of poverty line and also on the basis of sex.
If the population of males below poverty line for State Q is 2.4 million and that for State T is 6 million, then the total populations of States Q and T are in the ratio?The Following Table Gives The Percentage Distribution Of Pop...
  1.    1:3
  2.    2:5
  3.    3:7
  4.    4:9
 Discuss Question
Answer: Option B. -> 2:5
Answer: (b).2:5
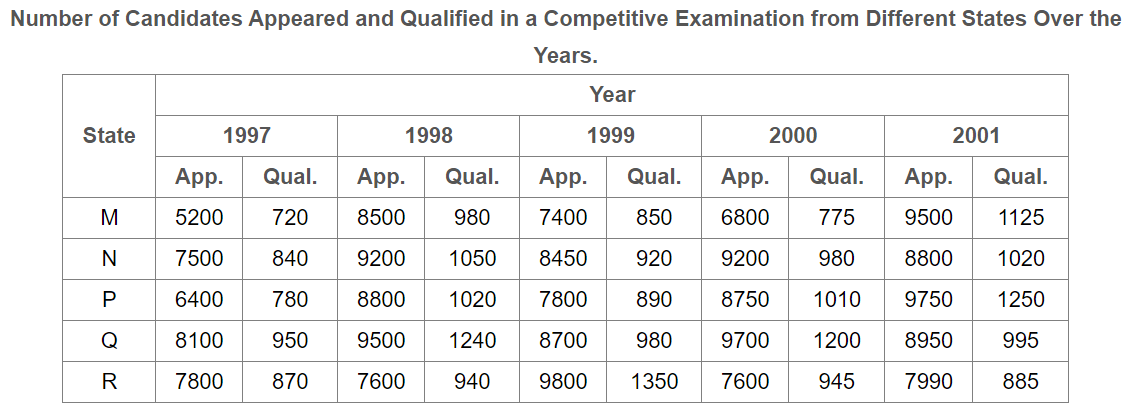
Question 7. Study the following table and answer the question based on it.
Total number of candidates qualified from all the states together in 1997 is approximately what percentage of the total number of candidates qualified from all the states together in 1998?Study The Following Table And Answer The Question Based On I...
  1.    72%
  2.    77%
  3.    80%
  4.    83%
 Discuss Question
Answer: Option C. -> 80%
Answer: (c).80%
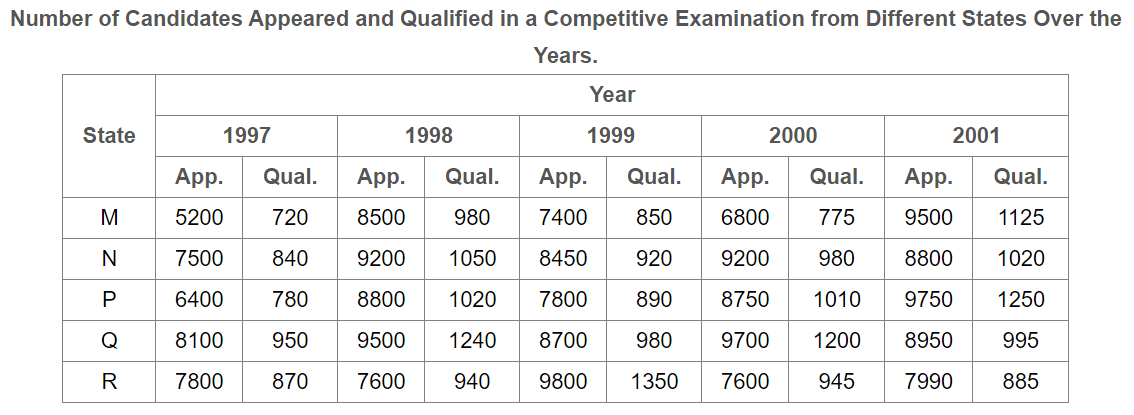
Question 8. Study the following table and answer the question based on it.
What is the average candidates who appeared from State Q during the given years?Study The Following Table And Answer The Question Based On I...
  1.    8700
  2.    8760
  3.    8990
  4.    8920
 Discuss Question
Answer: Option C. -> 8990
Answer: (c).8990
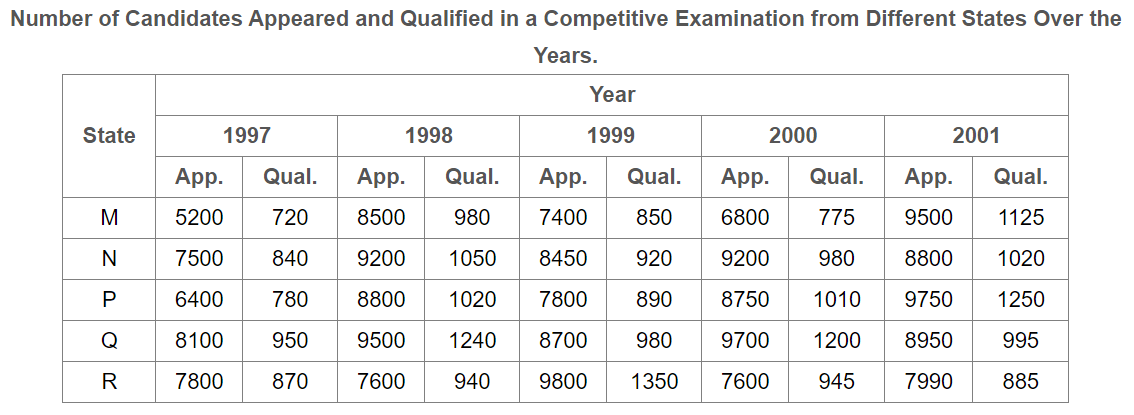
Question 9. Study the following table and answer the question based on it.
What is the percentage of candidates qualified from State N for all the years together, over the candidates appeared from State N during all the years together?Study The Following Table And Answer The Question Based On I...
  1.    12.36%
  2.    12.16%
  3.    11.47%
  4.    11.15%
 Discuss Question
Answer: Option D. -> 11.15%
Answer: (d).11.15%
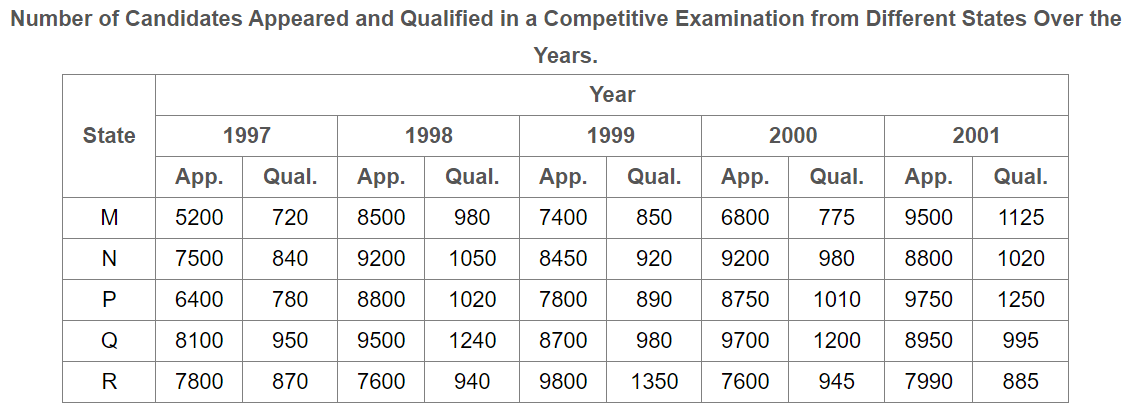
Question 10. Study the following table and answer the question based on it.
In which of the given years the number of candidates appeared from State P has maximum percentage of qualified candidates?Study The Following Table And Answer The Question Based On I...
  1.    1997
  2.    1998
  3.    1999
  4.    2001
 Discuss Question
Answer: Option D. -> 2001
Answer: (d).2001

Latest Videos

Latest Test Papers