Sail E0 Webinar

MCQs

Total Questions : 60 | Page 2 of 6 pages
Question 11. What is the basis for C-chart?
  1.    Normal distribution
  2.    Poisson distribution
  3.    Weibull distribution
  4.    Exponential distribution
 Discuss Question
Answer: Option B. -> Poisson distribution
Answer: (b).Poisson distribution
Question 12. When the subgroup size varies from one sample to another, U-chart is used.
  1.    True
  2.    False
  3.    May be True or False
  4.    Can't say
 Discuss Question
Answer: Option A. -> True
Answer: (a).True
Question 13. The control chart that measures the number of non-conformities is ____ and the one that measures the number of non-conformities per unit is ______
  1.    R-chart, S-chart
  2.    C-chart, U-chart
  3.    P-chart, R-chart
  4.    R-chart, P-chart
 Discuss Question
Answer: Option B. -> C-chart, U-chart
Answer: (b).C-chart, U-chart
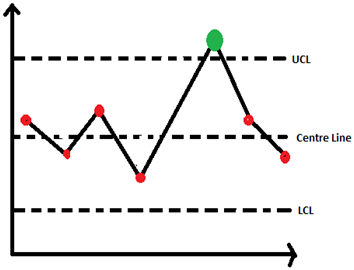
Question 14. Let the X-axis and Y-axis represent sample numbers and any quality characteristic value respectively. What does the ‘green color data point’ represent?Let The X-axis And Y-axis Represent Sample Numbers And Any Q...
  1.    Out-of-control sample value
  2.    In-control sample value
  3.    Minimum sample value
  4.    Mean sample value
 Discuss Question
Answer: Option A. -> Out-of-control sample value
Answer: (a).Out-of-control sample value
Question 15. Find the correct order of matching from the option given below.Find The Correct Order Of Matching From The Option Given Bel...
  1.    A-i, B-ii, C-iii
  2.    A-i, B-iii, C-ii
  3.    A-ii, B-i, C-iii
  4.    A-ii, B-iii, C-i
 Discuss Question
Answer: Option A. -> A-i, B-ii, C-iii
Answer: (a).A-i, B-ii, C-iii
Question 16. The data set for measuring width of an object which is 50 cm includes five readings which are 49.5 cm, 49.5 cm, 50.5 cm, 50.3 cm, and 49.7 cm. What can be the conclusion made by this study?
  1.    Data is precise and accurate
  2.    Data is precise but not accurate
  3.    Data is neither precise nor accurate
  4.    Data is not precise but accurate
 Discuss Question
Answer: Option A. -> Data is precise and accurate
Answer: (a).Data is precise and accurate
Question 17. The data set for measuring height of an object which is 80 cm includes five readings which are 40.5 cm, 81 cm, 72 cm, 48 cm, 50 cm. What can be the conclusion made by this study?
  1.    Data is precise and accurate
  2.    Data is precise but not accurate
  3.    Data is neither precise nor accurate
  4.    Data is not precise but accurate
 Discuss Question
Answer: Option C. -> Data is neither precise nor accurate
Answer: (c).Data is neither precise nor accurate
Question 18. Which of the following is not a measure of dispersion?
  1.    Range
  2.    Mean deviation
  3.    Mean
  4.    Standard deviation
 Discuss Question
Answer: Option C. -> Mean
Answer: (c).Mean
Question 19. If the diameter of a shaft is measured as 60 mm, 62 mm, 63 mm, 61 mm, 60 mm. What is the mean diameter that can be considered for calculation?
  1.    61.1 mm
  2.    61.2 mm
  3.    61.3 mm
  4.    61.4 mm
 Discuss Question
Answer: Option B. -> 61.2 mm
Answer: (b).61.2 mm
Question 20. Which of the following is not a measure of central tendency?
  1.    Range
  2.    Mean
  3.    Median
  4.    Mode
 Discuss Question
Answer: Option A. -> Range
Answer: (a).Range

Latest Videos

Latest Test Papers