Question
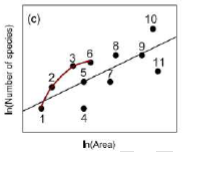
This curve gives you the number of species residing in a particular area (1,2,3‚Ķ..11). The areas 1, 2 ,3 and 6 have been joined using a continuous line. What other points should this line pass through in order for the curve to exhibit ‚Äúperiod of growth followed by saturation‚ÄĚ
Answer: Option D
:
D
Was this answer helpful ?
:
D
Option (d)
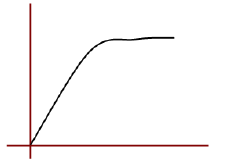
A curve should look like this if it has to exhibit ‚Äúperiod of growth followed by saturation‚ÄĚ
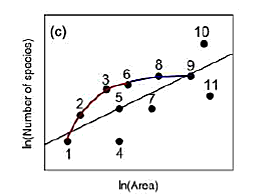
From the given graph, we can observe that joining the points 6, 8 and 9 will give us the desired curve.
(a) 7 ,11 This will exhibit a decline
(b) 8,9,11 till point 9, the curve will be as expected but after that it shows a decline
(c) 8,10 these points exhibits high growth and not saturation.
Was this answer helpful ?


Submit Solution