Menu
Popular Courses
Search
Question


Refer the graphs below to answer the following question:
In which of the following years is the contribution of IT industry to the GDP maximum (in value terms)?
Refer The Graphs Below To Answer The Following Question:In W...Refer The Graphs Below To Answer The Following Question:In W...


Options:
A .   2002
B .   2003
C .   2005
D .   2004
Answer: Option B
:
B

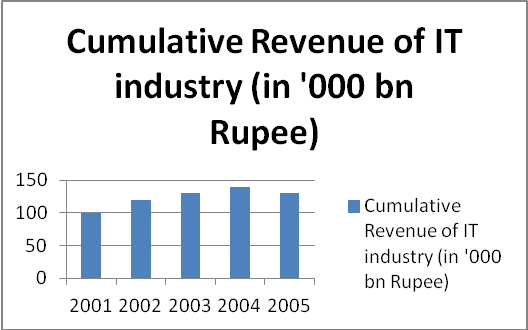
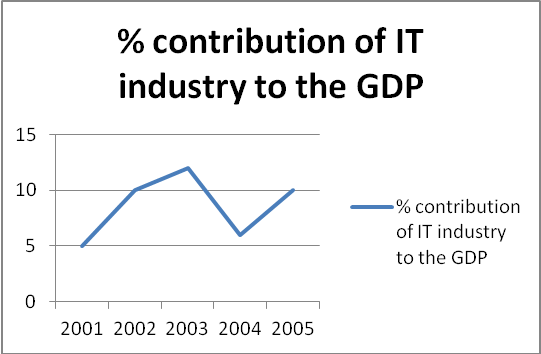
You can directly mark the answer as option (b)without any calculation. From 2001-2003, both the graphs are increasing. Thus 2003 will have the maximum value among 2001, 2002 and 2003. But then there is a big dip in the second curve which cannot compensate the increase in the first curve. 


Thus, it is quite clear from the graphs that the maximum value can be only from 2003 or 2005.


Revenue from IT industry is same for both 2003 and 2005, but the % contribution to GDP for 2003 is higher than for 2005. Thus (b) is the answer


Was this answer helpful ?
Next Question

Submit Comment/FeedBack

Your email address will not be published. Required fields are marked *

Share this page with your friends!

Latest Videos

Chapter 1 - GLOBAL STEEL SCENARIO & INDI Part 1 : (13-04-2024) INDUSTRY AND COMPANY AWARENESS (ICA)
Direction Sense Test Part 1 Reasoning (Hindi)
Chapter 1 - RMHP / OHP / OB & BP Part 1 : (14-02-2024) GPOE
Cube & Cuboid Part 1 Reasoning (Hindi)
Data Interpretation (DI) Basic Concept Reasoning (Hindi)
Counting Figures Part 1 Counting Of Straight Lines Reasoning (Hindi)
Real Numbers Part 7 Class 10 Maths
Real Numbers Part 1 Class 10 Maths
Polynomials Part 1 Class 10 Maths

Latest Test Papers

Chapter 3.1 : Overview of Finance & Acco Chapter 3 : Finance & Accounts SAIL E0 - GFM 2024
Chapter 2.1 : Overview Chapter 2 : Materials Management SAIL E0 - GFM 2024
Chapter 1.1 : Personnel Functions- An ov Chapter 1 : Personnel Management SAIL E0 - GFM 2024
GPOE / GPA Combined 1 Free CBT Mock Test SAIL E0 2024
CBT Mixed Test 1 GPOE/GPA SAIL E0 2024